

Issue #8
Measuring DevEx: When "Vibes" Aren't Enough 📊
Nothing makes executives' eyes glaze over faster than trying to explain the value of developer experience without concrete numbers to back it up.

Hey there, developrrrs! 👋 Nothing makes executives’ eyes 👀 glaze over faster than trying to explain the value of developer experience without concrete numbers to back it up. You know that moment in every budget meeting when someone asks, “But how do we measure the ROI?” and the room gets awkwardly quiet?
Well, today, we’re diving into the metrics that transform DevEx from a nice-to-have into a must-have business strategy. Whether you’re trying to justify that shiny new CI/CD pipeline or finally replace that ancient build system that runs on hopes and prayers, I’ve got you covered with metrics that actually matter. Grab your spreadsheets – we’re about to make DevEx speak C-suite! ✨
🤿 Deep Dive
When I tell engineering leaders they need to measure DevEx, I often get looks like I just suggested measuring how happy their coffee maker is. “But it’s all subjective!” they say, clutching their latest developer satisfaction survey. Sure, and my workout routine is going great, too – if we don’t count any actual metrics.
According to the DORA State of DevOps Report, elite-performing teams deploy 973 times more frequently than low-performers. That’s not a vibe – that’s math. And while measuring developer experience might seem like trying to quantify happiness (which, let’s be honest, probably involves 🍕 pizza consumption rates), there are actually concrete metrics that can tell you if your DevEx initiatives are working or just creating more meetings about creating fewer meetings.
Speaking C-Suite: The ROI of DevEx 💼
Let’s talk numbers that matter to your executives. According to Stripe’s research, poor developer experience costs companies approximately $300 billion annually. But flip that coin, and you’ll find that investing in DevEx delivers measurable returns:
Cost Savings:
-
42% reduction in engineering hours spent on maintenance tasks
-
30% decrease in onboarding time for new developers
-
15-20% reduction in infrastructure costs through optimized processes
Growth Metrics:
-
3.6x faster feature delivery (DORA Report)
-
2.5x better business outcomes in companies with high DevEx ratings
-
70% improvement in developer retention rates
When you translate DevEx improvements into business metrics, suddenly, “developer happiness” becomes a lot more interesting to your executives. Think of it this way: a 10% improvement in developer productivity isn’t just about happier developers – it’s about shipping features faster, reducing time-to-market, and staying ahead of competitors.
The Metrics That Actually Matter
Let’s break down the numbers that separate the DevEx champions from the “we’ll fix it later” crowd:
1. The DORA Four (Because Three Just Wasn’t Enough)
The DORA metrics have become the gold standard for measuring software delivery performance, and for good reason. They give us concrete numbers to work with:
-
Deployment Frequency: Elite teams deploy multiple times per day. If your deployment schedule looks more like a lunar calendar, you might have some work to do. Think about it: more frequent deployments mean smaller changes, lower risk, and faster feedback loops.
-
Lead Time for Changes: How long does it take code to go from commit to production? According to DORA, elite performers do this in less than one hour. Meanwhile, some teams measure this in geological eras. Long lead times often indicate process bottlenecks or overcomplication.
-
Time to Restore Service: When things break (and they will), how fast can you fix them? Elite teams recover in less than an hour. If your MTTR (Mean Time to Recovery) is longer than a Lord of the Rings marathon, we need to talk. Quick recovery times indicate good monitoring, effective debugging tools, and solid rollback procedures.
-
Change Failure Rate: What percentage of deployments cause problems? Elite teams maintain rates below 15%. If your deployments are more reliable than your dating life, you’re doing something right. This metric tells you whether your testing and quality processes are actually working.
2. Developer Time Allocation
The Stripe Developer Coefficient report dropped a truth bomb: developers spend only 32% of their time writing new code. The rest? Fighting with tools, waiting for builds, or trying to remember why that one service was named after a Pokemon character.
Here’s what to track:
-
Build times (if your coffee break syncs perfectly with your builds, they’re too long)
-
Time spent on setup and configuration
-
Documentation search time (how long before developers give up and ask Slack)
-
Code review cycles (are reviews moving at the speed of business or the speed of bureaucracy?)
3. The Human Element
Yes, we can actually measure this without resorting to emoji reactions:
-
Time to first commit for new hires (should be day one, not “eventually”)
-
Knowledge sharing metrics (how many questions get asked repeatedly?)
-
Tool adoption rates (if nobody’s using your new “productivity” tool, it might not be as productive as you think)
-
Onboarding completion time (because “figure it out as you go” isn’t a strategy)
The Warning Signs
Watch out for these red flags that indicate your DevEx might need some TLC:
-
More time in meetings about improving the process than actually improving the process
-
Documentation that’s older than your intern
-
The phrase “it works on my machine” becoming your team motto
-
Pull requests that age like fine wine (spoiler: code shouldn’t need to breathe)
-
The number of steps in your deployment checklist rivals your grocery list
Making the Numbers Work for You
Remember: metrics without context are like using Stack Overflow without reading the answers – technically possible, but probably not what you want. Here’s how to make them meaningful:
-
Set baselines: You can’t improve what you don’t measure. Start tracking these metrics now, even if the numbers make you want to hide under your desk.
-
Track trends, not just numbers: One bad deployment doesn’t make a pattern. Look for systematic issues that show up consistently.
-
Combine quantitative and qualitative data: Because sometimes the numbers lie, but the complaints don’t. Listen to your team’s feedback alongside the metrics.
-
Focus on actionable metrics: If you can’t do anything about a metric, it’s just a fancy number taking up dashboard space.
The Bottom Line
Good DevEx isn’t just about making developers happy (though that’s a nice bonus) – it’s about making them effective. And while you can’t directly measure developer happiness (yet), you can measure its impact on your business.
Next week, we’ll dive into cognitive load and its sneaky impact on developer experience. We’ll explore why your brain feels like a browser with too many tabs open and what you can do about it. Until then, remember: if you can’t measure it, you can’t meme it. Or something like that.
Stay metrics-driven! 📈
Powered by coffee ☕️ and an unhealthy obsession with deployment statistics
📊 Stat
Underrepresented Groups Face 24% More Burnout Due to 29% Higher Workload of Repetitive Tasks
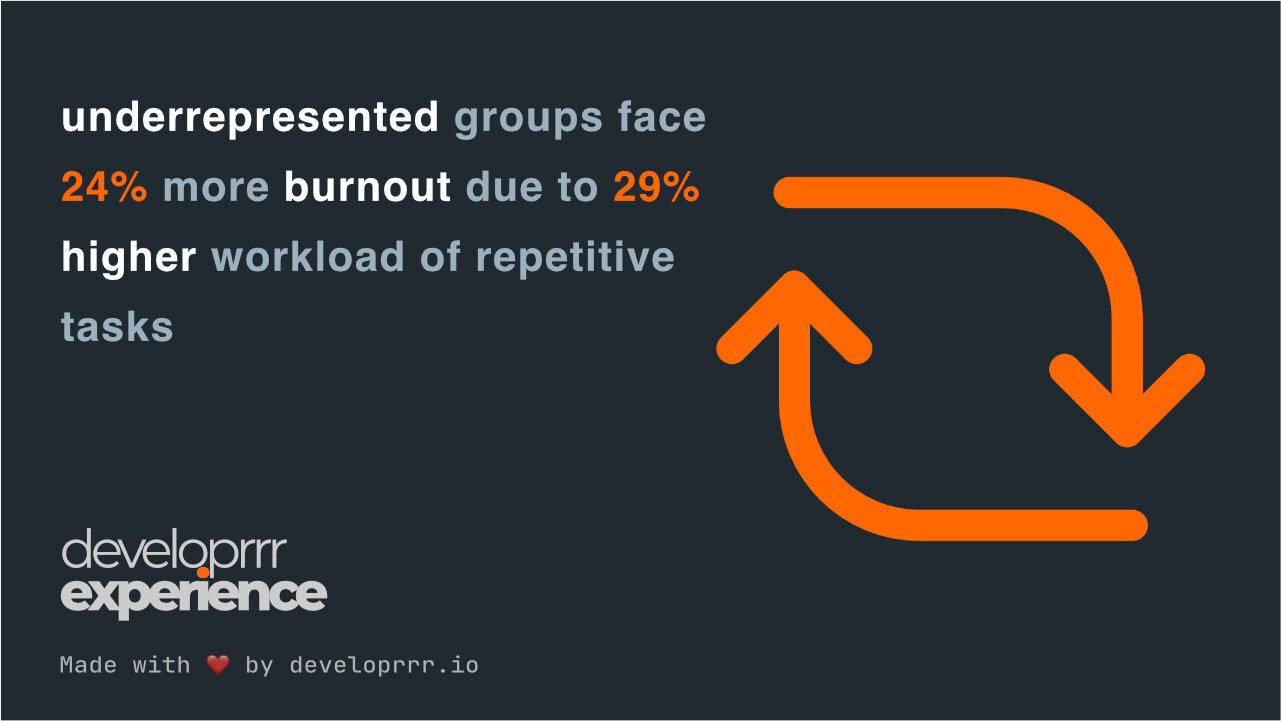
Disproportionate task allocation burdens underrepresented groups, contributing to higher burnout levels. These repetitive tasks often include creating and maintaining documentation, manual testing, administrative duties, and operational toil. Equitably distributing these responsibilities can mitigate disparities, improve morale, and foster inclusivity. Addressing systemic imbalances is vital for creating a healthier and more productive work environment.
📌 Essential Reads
🤖 Google’s New AI Agent ‘Jules’ to Assist Developers in Fixing Code. Google has introduced “Jules,” an experimental AI-powered code agent designed to automatically address coding errors in Python and JavaScript within GitHub workflows. Launched alongside Gemini 2.0, Jules aims to handle time-consuming tasks, allowing developers to focus on building projects. Currently, in early development, Jules is available to a select group of testers, with a broader release planned for early 2025.
🚀 Grid Dynamics Unveils Portal to Boost Developer Productivity. Grid Dynamics has announced the launch of its innovative developer portal designed to streamline the developer experience and enhance productivity. The portal aims to provide developers with the tools and resources needed to efficiently build and deploy applications.
🔒 J.P. Morgan Payments Enhances Developer Experience with New Portal. J.P. Morgan Payments has launched the Payments Developer Portal, providing developers with direct access to its suite of payment solutions. This initiative aims to foster innovation by allowing developers to build integrated payment solutions, thereby transforming the developer experience and attracting top tech talent.
🛠️ Tools
-
Husky is a tool to manage Git hooks easily and enforce consistent workflows directly from your repository.
-
Lightweight Charts is a JavaScript library for building interactive financial or timeline charts with minimal code.
-
AutoSpotting is an automation tool for optimizing AWS EC2 costs by using spot instances where possible without altering infrastructure code.
Get the next issue on Thursday
5-minute weekly reads showing how top engineering teams solve their biggest DevEx challenges and reduce burnout.
Subscribe for freeDelivered every Thursday. Trusted by 3,000+ engineers at companies like Stripe, Google, and Netflix.